Why is “Nominal Capacity” Different from “Actual Usable Energy”?
In equipment development or project procurement, calculating battery capacity is a critical step. However, many users find that a battery labeled “100Ah” rarely releases the full 100Ah during real-world load testing.
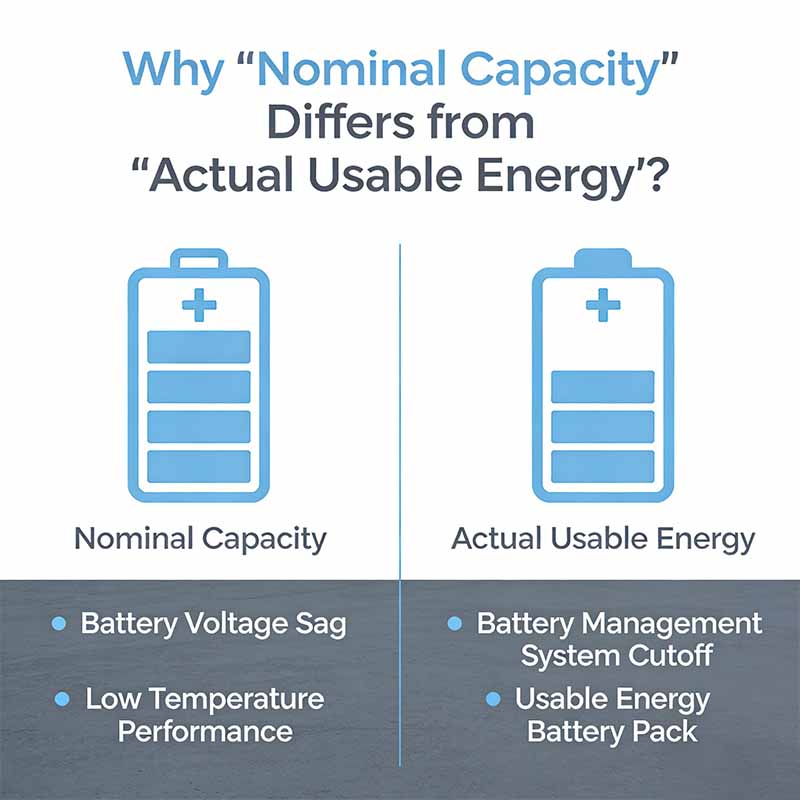
This isn’t due to “fake labeling.” Instead, lithium battery output is a dynamic variable influenced by physical conditions and system safety strategies. Here are the three core reasons behind this discrepancy.
■ Discharge Rates & Voltage Sag
A battery’s nominal capacity is typically measured under a 0.2C rate (a slow discharge over 5 hours). Generally, the lower the current, the more energy the battery can release.
- Polarization and Internal Resistance: High-current discharge increases electrochemical polarization and internal resistance. The higher the current, the larger the “voltage drop” created within the battery.
- Hitting the Cut-off Early: High current causes an instantaneous drop in voltage, known as Voltage Sag. Even if the battery still has chemical energy left, the voltage may hit the BMS or device “low-voltage protection line” prematurely, forcing the system to shut down.
📌 Think of it like this: Imagine a tube of toothpaste. If you squeeze gently from the bottom, you can get almost every bit out. But if you stomp on it with full force, the tube might burst or block the opening, leaving plenty of paste stuck inside. High current “stomps” on the battery, making the voltage drop so fast that the system thinks it’s empty, even though there’s still “paste” (energy) left.
■ Temperature: The Physics of Chemistry
Lithium batteries rely on ions moving through an electrolyte to create current. Temperature directly changes the “thickness” of that electrolyte and the speed at which ions can travel.
LFP (LiFePO4) vs. NMC (Ternary)
- LFP Batteries: Low temperature is their Achilles’ heel. Below 0°C (32°F), internal resistance spikes. At -20°C (-4°F), usable capacity often drops to just 50%-60% of the nominal rating.
- NMC Batteries: These handle cold much better. At -20°C (-4°F), they can usually maintain 70%-80% of their effective capacity.
📌 Think of it like this: The electrolyte inside a battery is like “engine oil.” In warm weather, it’s thin and slippery, so ions move fast. In the freezing cold, it becomes thick like “glue.” The ions get stuck, making it much harder to “pull” electricity out.
■ BMS Management Strategies
In professional equipment, the BMS (Battery Management System) deliberately reserves a “safety buffer” rather than letting the battery run down to true zero.
- DOD (Depth of Discharge) Limits: Frequently draining a battery to 0% causes irreversible damage to the chemical structure. To ensure a lifespan of thousands of cycles, a BMS will often set the “empty” mark at 10% remaining capacity.
- Voltage Mismatch: Your device’s required voltage range might be narrower than the battery’s discharge range. For example, a battery might still have energy at 3.0V, but if your equipment automatically shuts down at 3.2V due to “low power,” that remaining energy becomes unusable “dead weight.”
📌 Think of it like this: It’s exactly like the fuel light in a car. When the light turns on, there are actually a few liters left in the tank. The car warns you it’s “empty” to protect the fuel pump and ensure you don’t get stranded. Similarly, the BMS stops early to protect the battery so it lasts for years, not months.
■ Summary: An Engineering View of Capacity
When selecting a battery, a rigorous design should “discount” the nominal capacity based on these factors:
- Rate Discount: Reserve a 5%-10% voltage margin based on your peak current.
- Environmental Discount: Choose the right chemistry (LFP vs. NMC) and reserve extra capacity based on your lowest operating temperature.
- System Discount: Align the device’s cutoff voltage with the BMS settings to calculate the true “usable window.”
■ Get Professional Technical Support
Inaccurate capacity estimation can lead to unexpected shutdowns in the field. Understanding how a battery performs under specific loads and temperatures is the key to project success.
- Get discharge characteristic curves for different C-rates.
- Compare LFP vs. NMC efficiency in your specific environment.
- Optimize BMS thresholds designed for long-term reliability.